Growth Ceiling: The Math That Predicts Your Maximum ARR
Your growth ceiling is the maximum subscribers your business can reach at current acquisition and churn rates. Learn the formula, benchmarks, and how to raise it.
Dan Layfield
Growth at Codecademy, $10M → $50M ARR
Most subscription operators obsess over growth rate. They should obsess over growth ceiling.
Growth rate is the slope of the line. Growth ceiling is where the line stops. Two businesses can grow at identical 10% monthly rates and end up at completely different sizes — because one has a ceiling 4x higher than the other. The math is precise, the formula is simple, and most operators don't run it on their own numbers until they're already inside the stall.
This applies to SaaS companies, newsletters, membership sites, consumer apps — anything with recurring revenue. If you acquire customers and lose customers, you have a growth ceiling. The only question is whether you know yours.
I learned this scaling Codecademy from $10M to $50M ARR (2017-2021). The 5x climb wasn't a 5x acquisition increase — it was raising the ceiling by reducing churn while expanding revenue per subscriber. Every percentage point of monthly churn we shaved off was worth more than the prior point, because the ceiling compounds against churn the way LTV compounds against retention.
Growth Ceiling at a Glance
| Growth Rate | Growth Ceiling | |
|---|---|---|
| **What it measures** | How fast you're growing right now | The maximum subscribers you can reach at current trajectory |
| **Formula** | (Current − Previous) ÷ Previous × 100 | Monthly New Customers ÷ Monthly Churn Rate |
| **Tells you about** | Today's slope | Tomorrow's plateau |
| **What raises it** | More acquisition this month | Lower churn, more new customers, or annual plan mix |
| **Failure mode** | Looks great until the ceiling pulls it down | Invisible until you stall out near it |
| **What investors weight** | Less (a snapshot) | More (a structural property of the business) |
The short answer: Your growth ceiling is the maximum number of subscribers you can reach if your current acquisition and churn rates hold. The formula is monthly new customers divided by monthly churn rate — so 200 new subscribers per month against 5% monthly churn produces a ceiling of 4,000. Reducing churn is the highest-leverage lever because the ceiling is the quotient, not the difference: halving churn doubles the ceiling. Most subscription businesses obsess over the slope (growth rate) when they should be modeling the asymptote (growth ceiling). For most $1M-$25M ARR businesses, fixing involuntary churn first is the cheapest, fastest way to lift the ceiling.
What Is a Growth Ceiling?
A growth ceiling is the maximum number of subscribers your business will converge toward, given your current acquisition rate and churn rate. The formula is straightforward:
The Growth Ceiling Formula: Growth Ceiling = Monthly New Customers ÷ Monthly Churn Rate
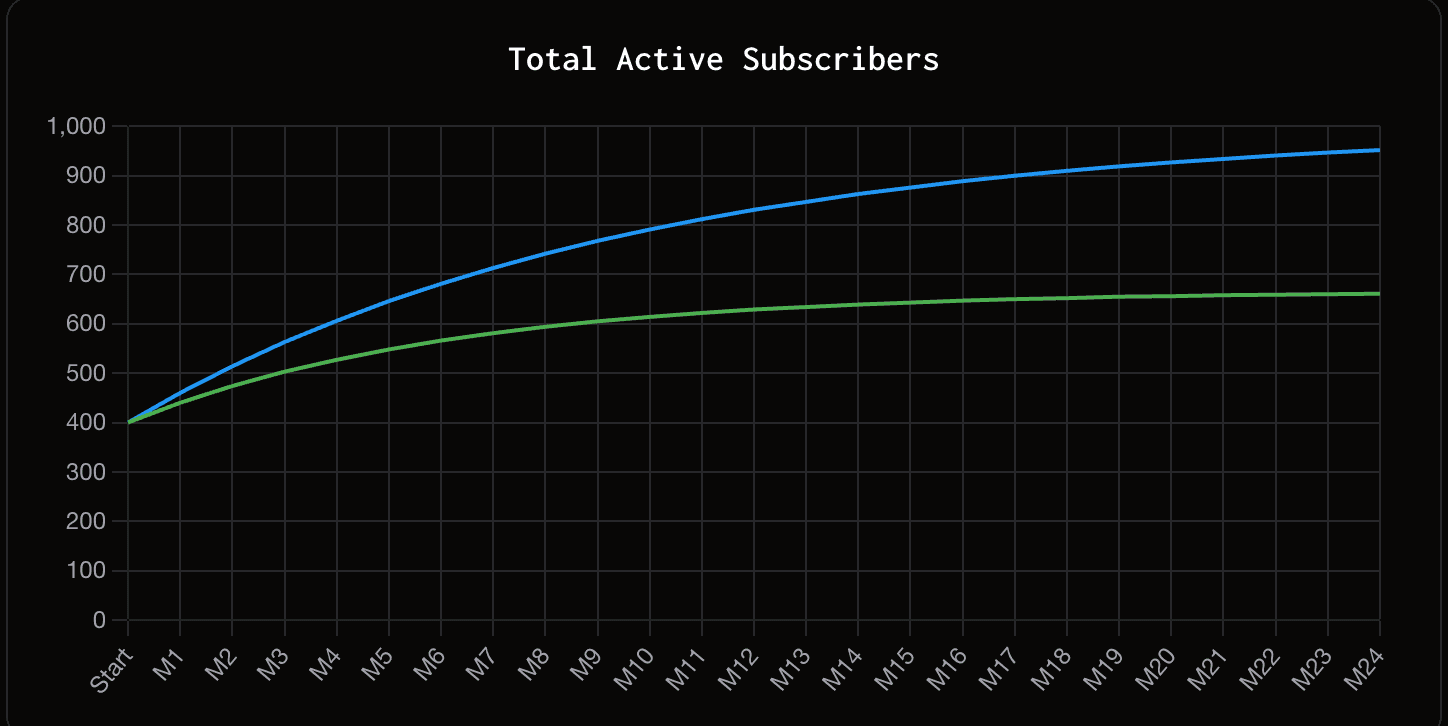
If you add 200 new subscribers per month and your monthly churn rate is 5%, your growth ceiling is 4,000 subscribers. You will never exceed 4,000 — not because your market ran out, but because at 4,000 subscribers, you lose 200 per month (5% of 4,000), which exactly equals what you add. Net growth goes to zero.
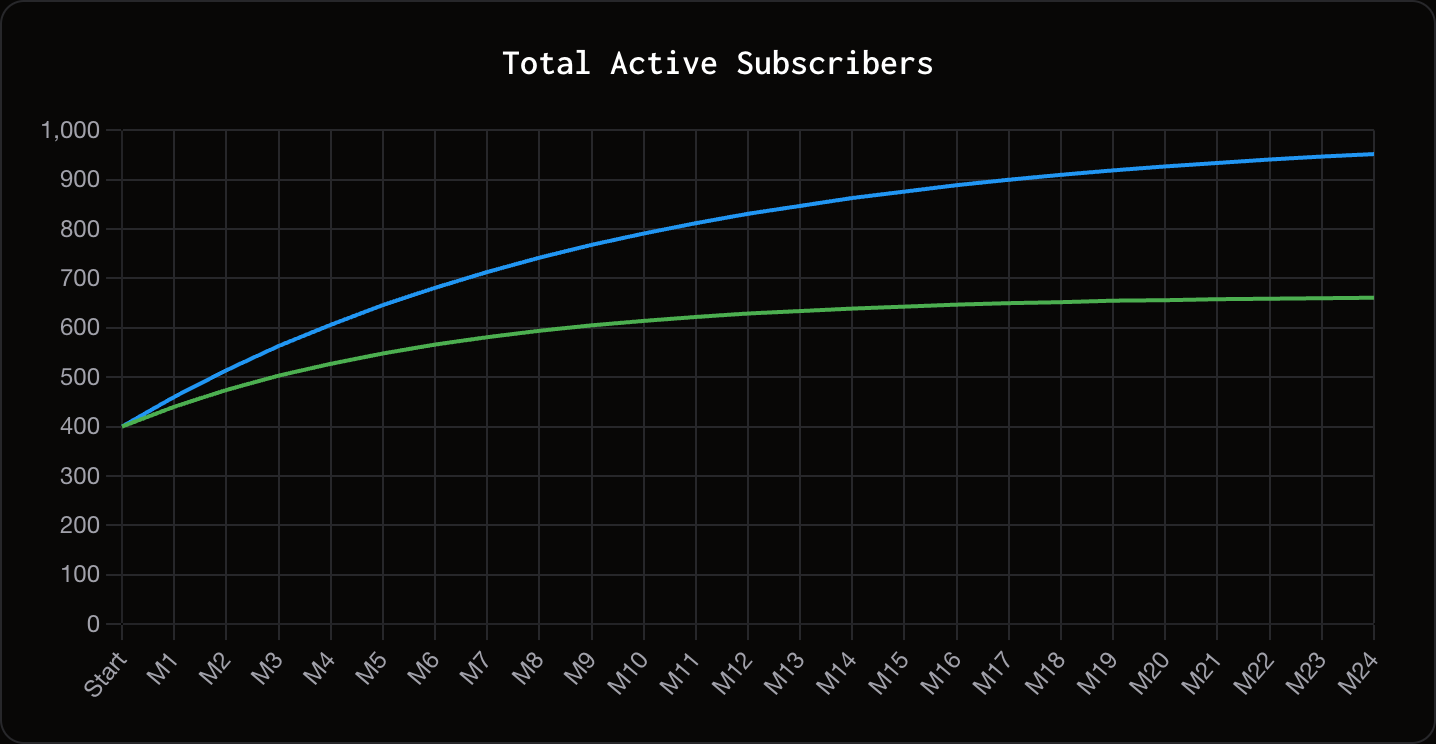
This isn't a projection or an estimate. It's a mathematical certainty. The closer you get to the ceiling, the more churn eats into your net growth. At 2,000 subscribers, you lose 100 and net 100. At 3,000, you lose 150 and net 50. At 3,800, you net just 10. The ceiling is an asymptote — you approach it but never quite reach it.
One critical distinction: a growth ceiling caps your subscriber count. A revenue ceiling is different because revenue per subscriber can change. You can raise prices, upsell premium tiers, or add usage-based components. A business stuck at 4,000 subscribers could still grow revenue from $200K to $400K ARR through expansion. The subscriber cap is real, but it's not the whole story.
How to Calculate Your Growth Ceiling
Start with the basic formula:
Step 1: Find your average monthly new subscribers. Don't use last month — use the average of the last 6 months to smooth out spikes. If you added 180, 220, 150, 250, 200, and 210 subscribers over the past 6 months, your average is 202.
Step 2: Find your monthly churn rate. Total cancellations last month divided by starting subscriber count. If you started with 3,000 and lost 150, that's 5% monthly churn.
Step 3: Divide. 202 / 0.05 = 4,040 subscribers. That's your ceiling.
For a revenue ceiling, layer in ARPU and expansion:
Revenue Ceiling = (New Customers x ARPU) / (Monthly Revenue Churn Rate)
The insider subscription playbook
One tactic that moves the needle — every Thursday
Real companies, real numbers, strategies you can steal. From the operator who grew Codecademy from $10M to $50M ARR.
Revenue churn is often lower than subscriber churn because expansion revenue from remaining customers offsets some losses. If your subscriber churn is 5% but upsells generate enough to offset 2%, your net revenue churn might be 3%. That meaningfully raises the revenue ceiling even though the subscriber cap stays the same.
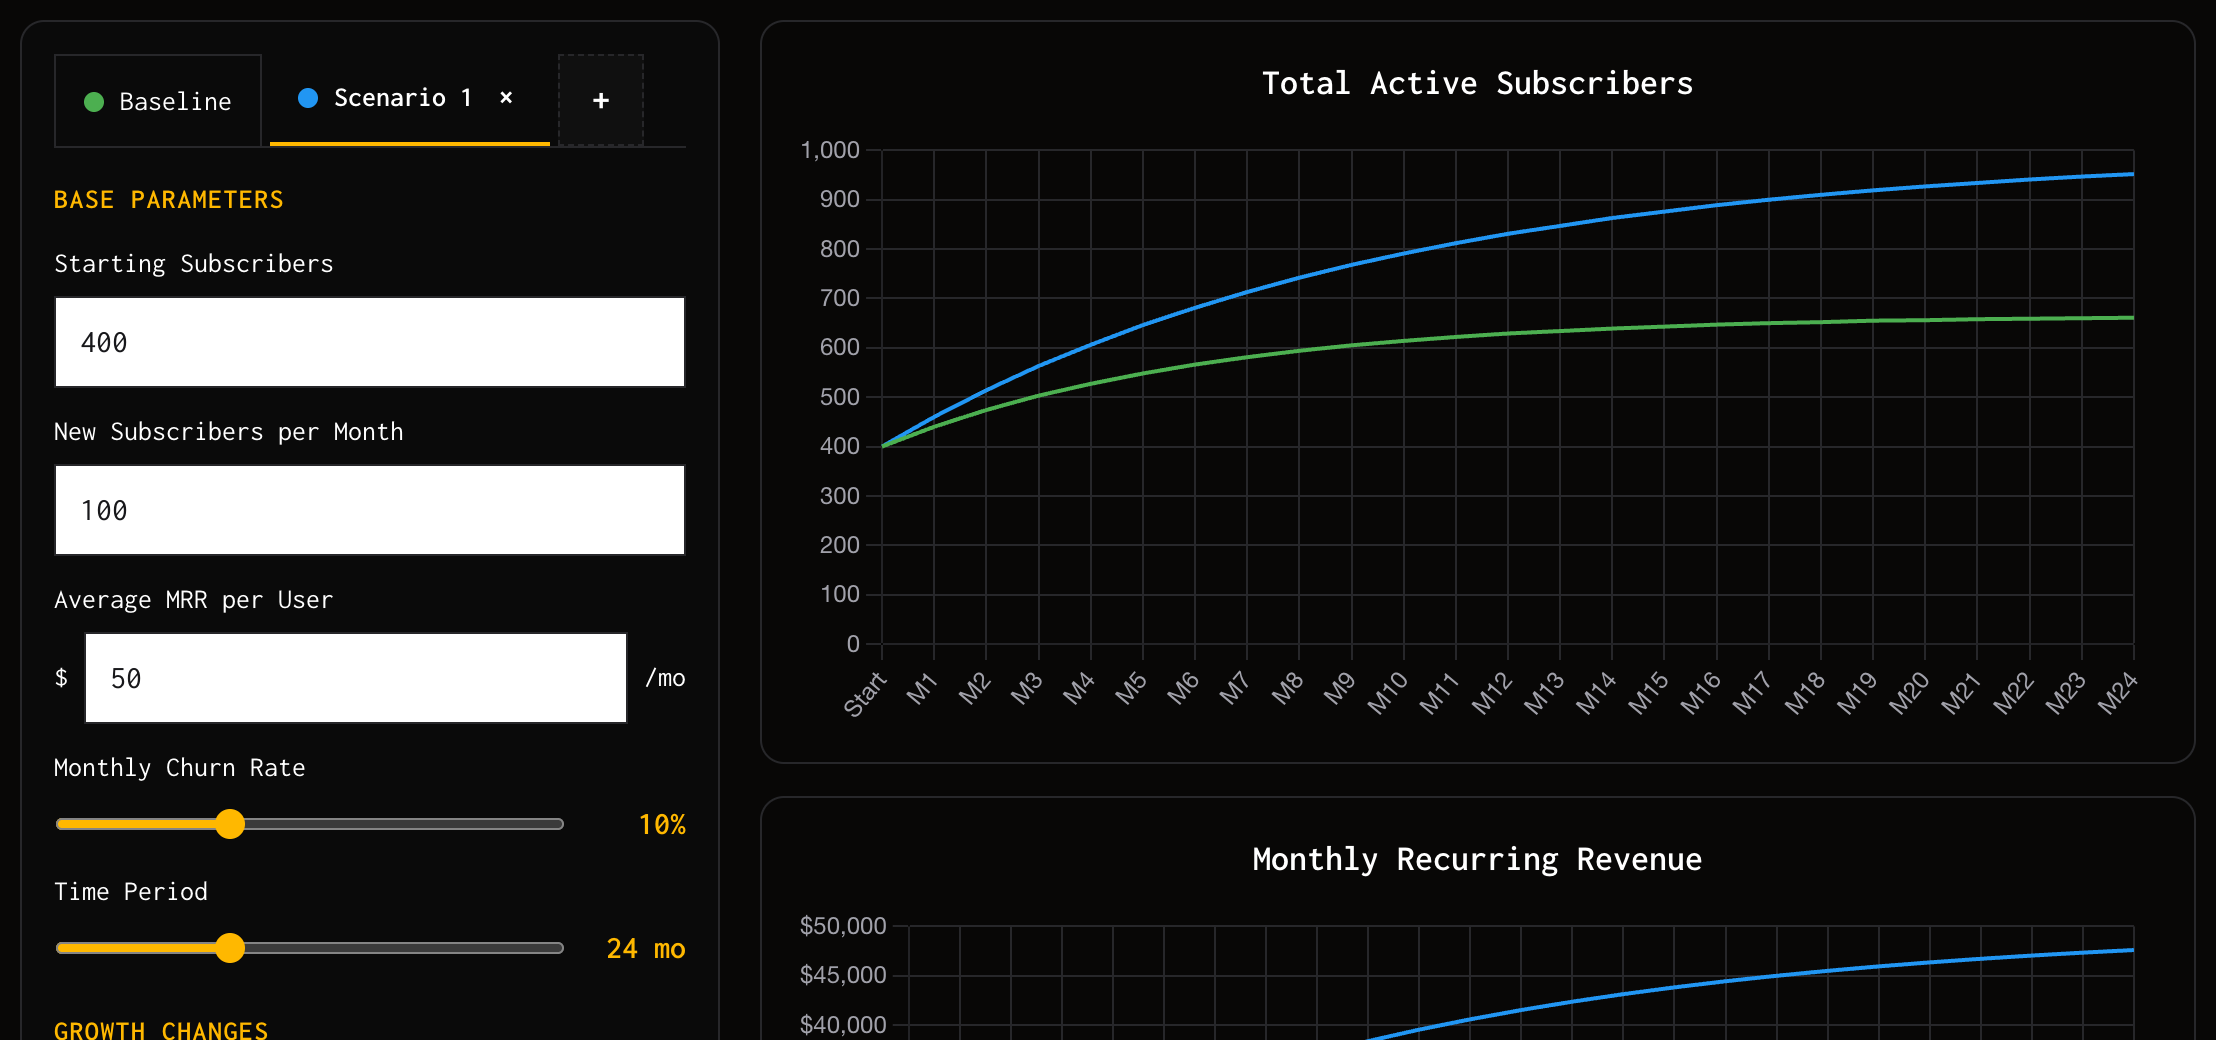
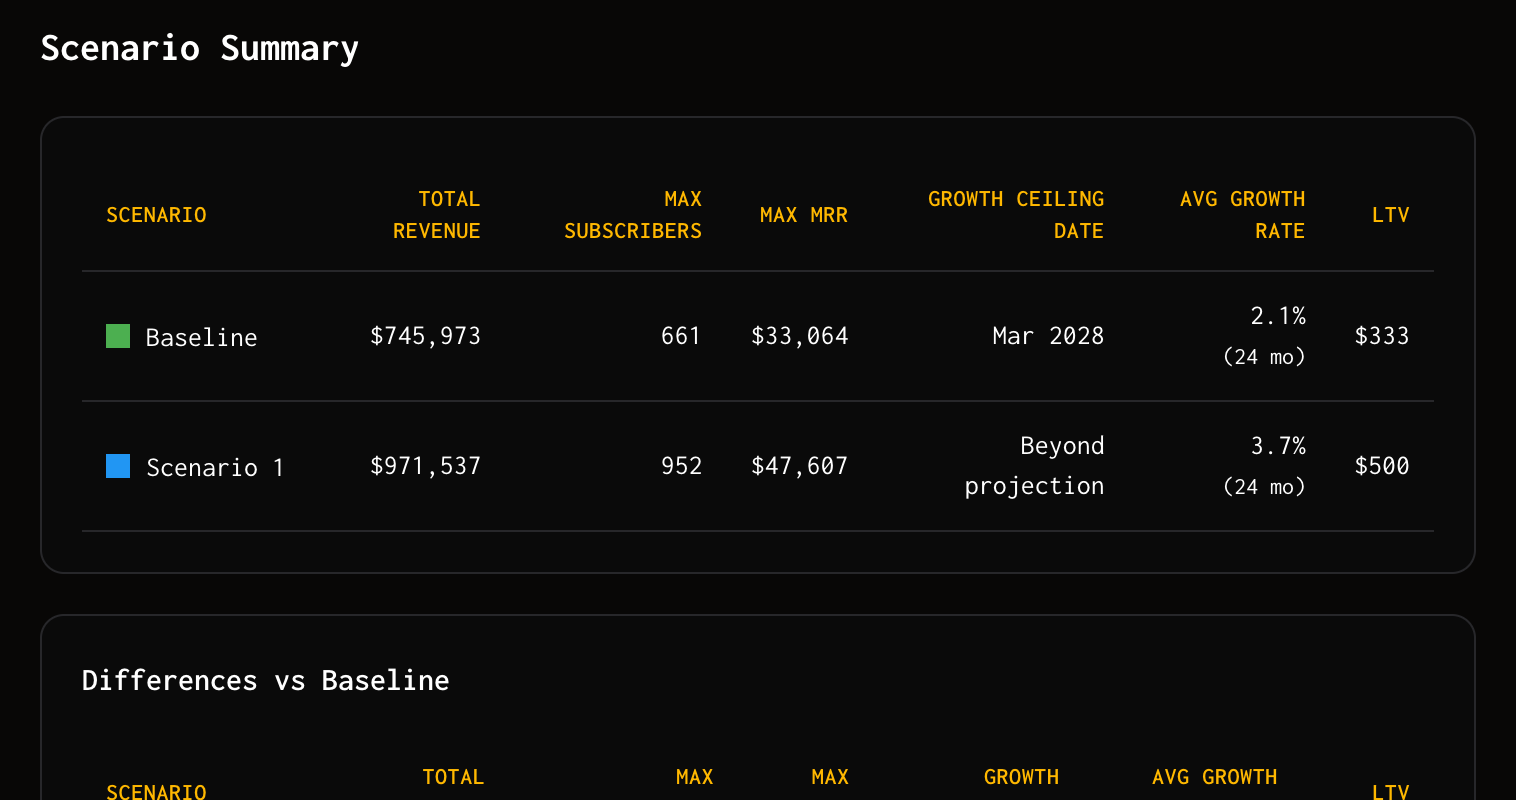
Model your specific numbers with the Growth Ceiling Calculator.
Why Growth Ceilings Matter More Than Growth Rate
Growth rate is the metric everyone tracks. Growth ceiling is the metric that actually determines your outcome. The two tell very different stories.
Consider two businesses:
Business A grows subscribers 10% month over month with 8% monthly churn. It looks like a rocket ship right now. But the ceiling is low — every 100 new subscribers per month yield a ceiling of just 1,250. This business will hit a wall fast, and the impressive growth rate will crater as it approaches the cap.
Business B grows 5% month over month with 2% monthly churn. Slower growth, less exciting board deck. But the ceiling is 5,000 per 100 new subscribers — 4x higher. This business will compound quietly and end up dramatically larger.
Growth rate without ceiling context is misleading. A business "growing fast" with high churn is a treadmill, not a growth engine. Investors and operators should care about ceiling distance — how far you are from your theoretical max — not just the slope of the line.
If you're at 1,000 subscribers with a ceiling of 1,200, you're not early-stage. You're almost done growing. If you're at 1,000 with a ceiling of 20,000, you have massive runway. Same subscriber count, completely different businesses.
Growth Ceiling Benchmarks by Business Type
These assume steady acquisition of 100 new subscribers per month. Scale proportionally for your actual numbers.
| Business Type | Typical Monthly Churn | Growth Ceiling (per 100 new/mo) |
|---|---|---|
| B2B SaaS (SMB) | 3-5% | 2,000-3,333 |
| B2B SaaS (Enterprise) | 1-2% | 5,000-10,000 |
| B2C / Consumer Subscription | 5-8% | 1,250-2,000 |
| Media / Newsletter | 4-7% | 1,429-2,500 |
Enterprise SaaS has dramatically higher ceilings because churn rates are low — long contracts, high switching costs, and sticky integrations. Consumer businesses face the opposite: low switching costs, easy cancellation, and discretionary spending that gets cut first.
Note: these are ceiling calculations, not guarantees. Your actual ceiling depends on your real acquisition and churn numbers. Plug yours into the Growth Ceiling Calculator to see where you land.
How to Raise Your Growth Ceiling
There are only two inputs to the ceiling formula, but several strategies to move them.
Reduce churn — the highest-leverage move
This is not a "nice to have." It's the single most impactful thing you can do. Every 1 percentage point reduction in monthly churn raises your ceiling by 25-50%, depending on where you start.
Going from 5% to 4% monthly churn raises the ceiling from 4,000 to 5,000 (a 25% increase). Going from 4% to 3% raises it to 6,667 (a 33% increase). The math gets better the lower you go.
Start with the churn rate guide to understand your baseline, then work through customer retention strategies for the tactical playbook.
Fix involuntary churn first
Before you rethink your product or redesign subscription onboarding, check your payment recovery. 20-40% of all churn in subscription businesses is involuntary — failed credit cards, expired payment methods, billing errors. These are customers who want to keep paying you and can't.
Smart dunning emails recover 30-50% of failed payments. It's the highest-ROI churn reduction work you can do, and it doesn't require any product changes.
Increase acquisition
More new subscribers per month raises the ceiling proportionally. If you double acquisition from 200 to 400, the ceiling doubles. But acquisition costs money — CAC is real, and doubling spend rarely doubles output.
This lever works but it's expensive and has diminishing returns. Fix churn first.
Build expansion revenue
Expansion revenue doesn't change your subscriber ceiling, but it raises your revenue ceiling — sometimes dramatically. If existing customers upgrade, buy add-ons, or increase usage, you can grow revenue even at subscriber capacity.
Businesses with strong net revenue retention above 110% can grow revenue indefinitely even if subscriber count plateaus. Read the upselling guide for specific tactics.
Shift to annual plans
Annual subscribers churn at roughly one-third the rate of monthly subscribers. If your monthly churn is 6%, annual subscribers typically churn around 2% per month equivalent (or ~20-25% annually vs ~50%+ for monthly).
Every subscriber you convert from monthly to annual billing dramatically reduces your blended churn rate and raises the ceiling. Offer a meaningful discount (typically 15-20%) and make annual the default option.
When the Growth Ceiling Formula Misleads
The formula assumes steady-state acquisition and churn. That's a reasonable model for most subscription businesses — but it breaks down in specific cases. Treat the result skeptically (or use a different metric) if:
You're a usage-based business. Pure consumption pricing (Snowflake, Twilio, Datadog) doesn't have a meaningful subscriber ceiling — revenue grows from existing customers using more. Track net revenue retention and revenue ceiling instead. A 4,000-subscriber cap is misleading if those 4,000 customers can 10x their spend.
You're heavily annual-prepay. Annual contracts smear churn across 12 months and create lumpy renewal cliffs. The monthly-churn formula understates the renewal risk. Use annual cohort retention curves instead.
Acquisition is highly seasonal. A tax-prep tool, an exam-prep platform, or a holiday-shopping subscription all violate the "steady acquisition" assumption. Run the formula on rolling 12-month averages, not last-month numbers.
You're pre-product-market-fit. With <6 months of data, both inputs (acquisition + churn) are too noisy. Track raw monthly active subscribers and 30/60/90-day retention instead. Growth ceiling becomes meaningful once your churn rate stabilizes.
Your churn rate is dropping fast. If you just shipped a fix and churn dropped from 6% to 3% last month, the ceiling formula tells you where you'd plateau at the new rate — but you don't yet know if 3% holds. Wait 2-3 months before re-running.
FAQ
What is a growth ceiling in business?
A growth ceiling is the maximum subscriber count a subscription business can reach at its current acquisition and churn rates. It's calculated by dividing monthly new customers by monthly churn rate. Unlike market size or TAM, a growth ceiling is a mathematical limit based on your actual operating metrics.
How do you break through a growth ceiling?
You break through by changing the inputs: reduce churn rate, increase acquisition rate, or both. Reducing churn is typically more effective because it raises the ceiling exponentially — a 1% churn reduction has more impact than a proportional increase in acquisition. Start with involuntary churn (failed payments), then work on retention.
What's a good growth ceiling for SaaS?
It depends on your business model. Enterprise SaaS with 1-2% monthly churn has ceilings of 5,000-10,000 per 100 monthly new customers. SMB SaaS with 3-5% monthly churn lands at 2,000-3,333. The "good" ceiling is one that supports your revenue targets — multiply the ceiling by your ARPU to check.
Is growth ceiling the same as TAM?
No. TAM (Total Addressable Market) is the theoretical maximum number of possible customers. Your growth ceiling is usually much lower — it's the practical limit based on how fast you acquire and lose customers. You can have a TAM of 1 million businesses but a growth ceiling of 5,000 subscribers if your churn is high. TAM is a market question; growth ceiling is an operational one.
How does churn rate affect growth ceiling?
Churn rate is the denominator in the growth ceiling formula, which means it has an outsized impact. Halving your churn rate doubles your ceiling. Going from 8% to 4% monthly churn takes the same 100-new-customers-per-month business from a ceiling of 1,250 to 2,500. Churn reduction is the most powerful lever for raising a growth ceiling.
What to Do Next
Knowing your growth ceiling is the first step. The next step is deciding which lever to pull — and by how much — to raise it.
Start by modeling your current numbers with the Growth Ceiling Calculator. Then audit your churn by working through the churn rate guide and customer retention strategies. If you're losing subscribers to failed payments, the dunning emails guide is the fastest fix. For revenue ceiling specifically, read the net revenue retention guide.
The businesses that grow past their ceiling aren't the ones that spend more on acquisition. They're the ones that fix the leak.
Take the Subscription Revenue Leak Audit →
52 checklist items across 8 revenue leak categories. Takes 10 minutes. Shows you exactly which leaks are pulling your ceiling down — and which fix lifts it the most.

Dan Layfield
Dan ran growth at Codecademy, scaling ARR from $10M to $55M before the company was acquired for $525M. He now advises subscription businesses on pricing, retention, and revenue optimization.
Work with Dan →Related Guides
LTV:CAC Ratio: What It Means, How to Calculate It, and What's a Good Ratio
The 3:1 LTV:CAC ratio is folklore. Here's the real benchmark by business stage, channel, and margin profile — with formulas and sourced numbers.
18 min readNet Revenue Retention: The Metric That Proves You Can Grow Without More Traffic
Net revenue retention (NRR) shows if your existing subscribers are becoming more valuable. Learn how to calculate, benchmark, and improve it.
31 min readPrice Localization: How Subscription Businesses Unlock International Revenue
Learn how to implement price localization for your subscription business — from currency display to full purchasing power parity (PPP) adjustments. Stop losing international customers.
Get the playbook every Thursday
Weekly strategies for subscription businesses. Real companies, real numbers, tactics you can steal. From the operator who grew Codecademy from $10M to $50M ARR.