Annual Churn Rate: Formula, Benchmarks, and How to Calculate It
If you multiply monthly churn by 12 you overstate annual churn by ~50%. Here's the right formula, real-company benchmarks, and the conversion math operators get wrong.
Dan Layfield
Growth at Codecademy, $10M → $50M ARR
In This Guide
- Annual Churn vs Monthly Churn vs Revenue Churn at a Glance
- What is annual churn rate?
- How to calculate annual churn rate
- Annual vs monthly churn rate: the conversion math everyone gets wrong
- Annual churn rate benchmarks by industry
- What's a good annual churn rate?
- How to reduce annual churn rate
- When NOT to obsess over annual churn rate
- FAQ
- What to Do Next
If you're multiplying your monthly churn by 12 to estimate annual churn, you're overstating churn by roughly 50%.
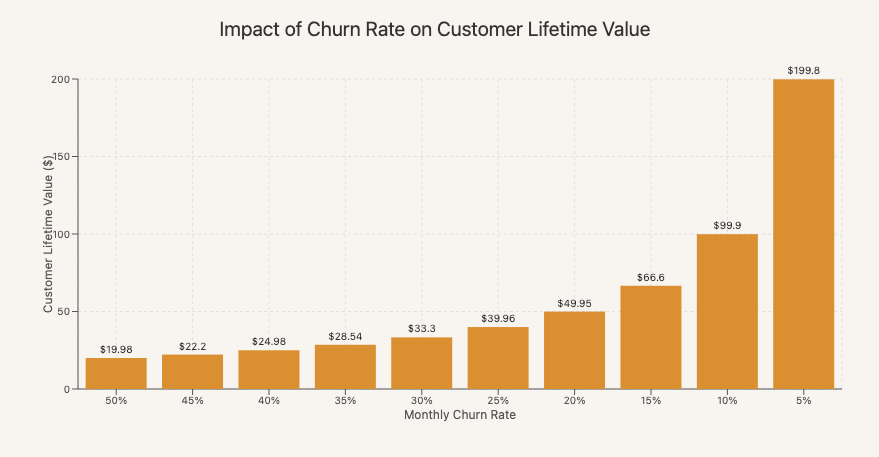
That's not a rounding error. A 5% monthly churn rate doesn't equal 60% annual churn. It equals about 46% — because each month's losses compound on a shrinking base, not on the original cohort. The math is a one-line formula. The mistake is what costs operators credibility in board meetings, investor decks, and benchmarking conversations.
I figured this out at Codecademy while scaling the business from $10M to $50M in annual recurring revenue. We spent more than one cycle defending churn numbers that were technically right but presented in a way nobody else used — and the conversation kept getting derailed because the benchmarks we were comparing against were calculated on a different cadence. Once we standardized on annual churn for board reporting (and kept monthly for ops dashboards), the numbers actually started telling the same story.
This guide covers the formula, the three conversion mistakes nearly everyone makes, real-company annual churn benchmarks pulled from public filings, and what "good" actually looks like by stage and segment.
Annual Churn vs Monthly Churn vs Revenue Churn at a Glance
| Annual Churn | Monthly Churn | Revenue Churn | |
|---|---|---|---|
| **Definition** | % of subscribers lost over 12 months | % of subscribers lost in one month | % of MRR/ARR lost (not subscribers) |
| **Formula** | 1 − (1 − monthly churn)^12 | Cancellations ÷ starting subs | MRR lost ÷ starting MRR |
| **What it measures** | Long-term retention; renewal-cycle loss | Short-term retention; ops health | Dollar impact, weighted by plan size |
| **When to use** | Board reporting, investor decks, annual cohorts, B2B SaaS with annual contracts | Ops dashboards, monthly trend lines, fast-iteration teams | Any time customers are on different price points |
| **Common mistake** | Computing as monthly × 12 (overstates by ~30-50%) | Treating $9 and $299 customers identically | Mixing logo churn and revenue churn at the same cadence |
The short answer: Annual churn is not monthly churn × 12. The correct formula is 1 − (1 − monthly churn)^12, which accounts for compounding on a shrinking base. A 5% monthly churn rate = ~46% annual churn, not 60%. And whichever cadence you report, pick one metric — logo or revenue — and stick with it, because the two numbers can move in opposite directions for the same business.
What is annual churn rate?
Annual churn rate is the percentage of subscribers — or revenue — that a business loses over a 12-month period. It's the single number most investors, boards, and benchmark databases use to compare subscription businesses, because it normalizes across companies with different billing cadences (monthly, quarterly, annual contracts).
The reason it gets calculated wrong so often is that most operators live in monthly churn numbers day-to-day, then need to translate to annual for reporting. The naïve translation — multiply by 12 — is wrong. The real math is below. First, the terms you'll see used interchangeably (and shouldn't be):
Annual churn rate. The percentage of subscribers lost across a 12-month window. Calculated either from a cohort (everyone who was a subscriber on January 1 — how many are gone by December 31?) or compounded from monthly churn. The compounded formula is what most people get wrong.
Gross annual churn. The total percentage of subscribers (or MRR) lost in the period, before adding back any expansion revenue from upsells, cross-sells, or seat growth. This is the honest "how many did we lose" number. If you started with $100,000 ARR and lost $20,000 to cancellations and downgrades over 12 months, gross annual churn is 20%.
Net annual churn. Gross churn minus expansion revenue. If you lost $20,000 but gained $25,000 from existing-customer expansion, net annual churn is -5%. Negative net churn means your existing base grew in value faster than others left — the defining trait of best-in-class subscription businesses. The inverse number — net revenue retention or NRR — is what most public companies disclose instead.
Logo churn (a.k.a. customer churn). The percentage of accounts or subscribers that cancelled, regardless of dollar value. A 5% annual logo churn means you lost 5 of every 100 customer logos. Useful for understanding base-level retention and product-market fit; misleading for revenue forecasting because it weights a $9 customer the same as a $9,000 one.
Revenue churn. The percentage of dollars lost. A $9 customer churning counts much less than a $9,000 customer churning. Always disclose this alongside logo churn at the annual cadence — they often tell different stories. (For more on the gross/net/voluntary/involuntary split inside the period, see the churn rate guide.)
How to calculate annual churn rate
Two ways to calculate it, and they answer different questions.
Method 1: Direct cohort measurement. Take everyone who was a subscriber on a specific date 12 months ago. Count how many are still subscribers today. That percentage who left is your true annual churn for that cohort.
Annual Churn Rate = (Subscribers Lost Over 12 Months ÷ Subscribers at Start of Period) × 100
If you had 10,000 subscribers on May 22, 2025 and 6,400 are still active today, you lost 3,600 — an annual churn rate of 36%. This is the gold standard because it's based on actual behavior of a real cohort, not extrapolated from short windows.
Method 2: Compound from monthly churn. If you only have a recent monthly churn number (because the business is new, or the metric has been shifting), you can compound it:
Annual Churn Rate = 1 − (1 − Monthly Churn Rate)^12
If your monthly churn is 5%: 1 − (1 − 0.05)^12 = 1 − 0.5404 = 0.4596, or ~46% annual churn. If your monthly churn is 3%: 1 − (1 − 0.03)^12 = 1 − 0.6938 = 0.3062, or ~31% annual churn.
This formula assumes monthly churn stays constant across the year. In practice it won't — early-tenure subscribers churn faster than long-tenure ones — so the compounded estimate will tend to overstate annual churn slightly compared to the true cohort measurement. Use it as an upper bound when cohort data isn't available yet.
Either method works. The mistake to avoid is in the next section.
Annual vs monthly churn rate: the conversion math everyone gets wrong
Here's the formula that operators run in their head and get wrong:
WRONG: Annual Churn ≈ Monthly Churn × 12
This assumes that each month you lose a fixed percentage of your original cohort. You don't. You lose a fixed percentage of whoever is still there.
Let's walk through it. Start with 1,000 subscribers and a 5% monthly churn rate. No new acquisitions, just churn.
| Month | Starting subs | Subs lost (5%) | Ending subs |
|---|---|---|---|
| 1 | 1,000 | 50 | 950 |
| 2 | 950 | 47.5 | 902.5 |
| 3 | 902.5 | 45.1 | 857.4 |
| 6 | 773.8 | 38.7 | 735.1 |
| 9 | 663.4 | 33.2 | 630.2 |
| 12 | 568.8 | 28.4 | 540.4 |
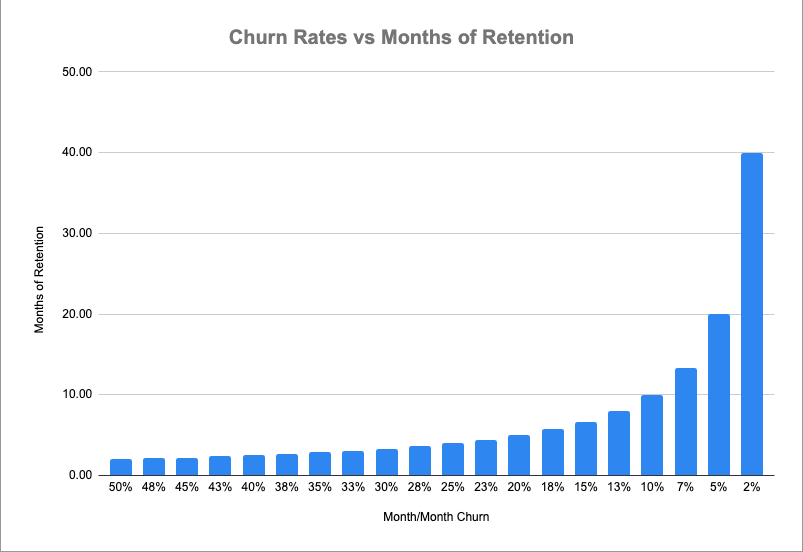
After 12 months you have ~540 subscribers, not 400. You lost ~46% of your base, not 60%. The naïve monthly × 12 formula overstates annual churn by about 14 percentage points in this example — or about 30% relative to the true number. At higher monthly churn rates the gap is even wider. At 10% monthly churn, naïve math says 120% (impossible). The compound formula gives the real answer: 72%.
Three conversion mistakes operators make most often:
Mistake 1: Multiplying monthly by 12. Covered above. The cleanest sanity check: if monthly × 12 ever exceeds 100%, you know you've used the wrong formula.
Mistake 2: Mixing logo churn and revenue churn across cadences. A common board-deck error: "We have 30% annual churn" — but that's the annualized monthly logo churn, while the benchmark you're comparing against is annual revenue churn from a cohort study. Different number, different conclusion. Always label which one you're presenting.
The insider subscription playbook
One tactic that moves the needle — every Thursday
Real companies, real numbers, strategies you can steal. From the operator who grew Codecademy from $10M to $50M ARR.
Mistake 3: Misreading benchmarks built on monthly cadence as annual. When you read "the average SaaS company churns 5% per month," that's a monthly figure (= ~46% annual). When you read "best-in-class B2B SaaS retains 90% of customers," that's likely annual (= ~0.9% monthly). These are not comparable until you put them on the same cadence. The Recurly benchmark (overall 3.27%, Recurly research, 2024) is a monthly number — annualizes to ~33%.
If you take one rule from this guide: when you publish or quote a churn number, label its cadence and whether it's logo or revenue. Most arguments about churn aren't about the underlying number — they're about people comparing two different numbers and not realizing it.
Annual churn rate benchmarks by industry
Public companies rarely disclose annual gross churn directly. What they do disclose — usually in 10-Ks — is net revenue retention (NRR), gross dollar retention, subscriber counts year over year, or commentary about retention trends. The figures below are pulled from public filings, investor decks, or third-party measurement firms that track subscription panels. Annual churn is the inverse of annual retention: if NRR is 110%, gross annual revenue churn is ~10% before expansion (and net is -10% after).

| Company | Segment | Annual retention / NRR | Implied annual churn | Source |
|---|---|---|---|---|
| Snowflake | Enterprise data cloud | 126% NRR (Q4 FY25, reported Feb 2025) | Net: −26%. Gross retention not disclosed directly; historically high-90s% | [Snowflake Q4 FY25 investor letter, Feb 26, 2025](https://investors.snowflake.com/financials/quarterly-results) |
| HubSpot | B2B SMB SaaS | NRR 102% (Q1 FY25, reported May 2025); peaked at 115% in 2021 | Net: −2%. Customer-dollar retention "in the high-80s" implies ~10-15% annual gross dollar churn | [HubSpot Q1 2025 results (May 2025)](https://ir.hubspot.com/) via [SaaStr NRR history](https://www.saastr.com/the-complete-history-of-hubspots-net-revenue-retention-from-88-6-at-ipo-to-115-peak-and-why-102-today-is-still-strong/) |
| Netflix | Consumer streaming | ~1.8% monthly gross churn (Antenna estimate, Sept 2024) | ~20% annual gross churn. Netflix itself does not disclose churn in its 10-K | [Antenna, Premium SVOD churn analysis (Sept 2024)](https://www.antenna.live/insights/checking-in-on-premium-svod-churn) |
| Spotify | Consumer streaming | ~2% monthly Premium churn (Antenna / Music Ally, mid-2024) | ~22% annual gross churn. Spotify reports Premium sub count + ARPU, not a standardized churn rate | [Music Ally on Antenna data (June 2024)](https://musically.com/2024/06/04/us-study-hails-loyalty-of-spotifys-music-streaming-subscribers/) |
| Slack (pre-Salesforce) | B2B SaaS | Net Dollar Retention 143% (FY ending Jan 31, 2019) | Net: −43%. Gross logo churn not disclosed in S-1 | [Slack S-1 (April 2019)](https://www.sec.gov/Archives/edgar/data/1764925/000162828019004786/slacks-1.htm) |
| Duolingo | Consumer learning | ~8-9% monthly subscriber churn (industry estimate) | ~65% annual gross logo churn. Duolingo does not disclose churn directly | [Duolingo Q2 2024 earnings (Aug 2024)](https://investors.duolingo.com/news-releases/news-release-details/duolingo-hits-100m-maus-reports-59-dau-growth-and-41-revenue) |
| Recurly average (DTC) | Consumer subscriptions across panel | 6.5% monthly average | ~55% annual gross churn | [Recurly benchmarks (2024)](https://recurly.com/research/churn-rate-benchmarks/) |
| Recurly average (B2B) | Business subscriptions across panel | 3.8% monthly average | ~37% annual gross churn | [Recurly benchmarks (2024)](https://recurly.com/research/churn-rate-benchmarks/) |
A few patterns worth lifting out:
- Enterprise SaaS clusters in single-digit annual gross churn, often with 110%+ NRR. Snowflake's 126% NRR is best-in-class but not unheard of for data infrastructure companies with usage-based expansion.
- Consumer streaming sits at ~20-25% annual gross churn. That's structurally the floor for "always-on" entertainment categories; Netflix is the ceiling of that range.
- Consumer learning and habit-formation apps (Duolingo, fitness, meditation) routinely run 50-70% annual gross churn. This is not a bug — it's the natural lifecycle. Users hit their goal or give up. The right monetization response is aggressive annual plans priced against retention, not retention heroics.
- The biggest gap between businesses isn't churn rate — it's expansion. Snowflake and HubSpot both probably lose 10-15% of dollars annually to cancellations and downgrades. The difference is Snowflake's existing customers grow ~40 points of dollar value each year, and HubSpot's grow ~2-5 points.
- Annual churn is almost always lower than the compound-from-monthly estimate suggests — once a cohort matures past month 6 or 7, monthly churn tends to drop materially. Compounded estimates are useful for sanity-checking but understate how much retention improves with tenure.
A note on how to read these numbers
Two traps to avoid when comparing your annual churn to the table above:
First, currency unit. Snowflake's NRR is dollar-based across enterprise contracts that often grow via usage; HubSpot's is dollar-based across mostly seat-based SMB contracts; Netflix and Spotify's Antenna estimates are subscriber-based across consumer plans. A 20% subscriber churn at Netflix and a 20% dollar churn at HubSpot describe very different business realities.
Second, the denominator. Some companies measure annual churn against the cohort of subscribers active 12 months ago (a cohort measurement). Others measure it as the trailing-twelve-months ratio of cancellations to the average subscriber base. The two can differ by several percentage points, especially in fast-growing businesses where the base today is much larger than 12 months ago. When you see an annual churn figure, check whether it's cohort-based or trailing — and use the same method consistently when comparing yourself.
Sources cited above are public investor filings (10-Ks, S-1s, quarterly earnings) plus third-party measurement firms (Antenna for SVOD, Recurly for cross-vertical benchmarks). NRR and "implied churn" figures are derived from those sources; where a company does not directly disclose churn, the figure is labeled as an estimate or proxy.
What's a good annual churn rate?
"Good" depends on your stage, your segment, and your price point. Three benchmarks worth committing to memory:
By stage:
- Pre-PMF / first 12 months: Don't optimize annual churn — you don't have enough data, and the cohort hasn't matured. Focus on month-2 and month-3 retention as leading indicators.
- Year 1-3 (post-PMF, scaling): B2B SaaS should target <20% annual gross logo churn (~1.5-2% monthly). B2C should target <50% annual gross churn (~5% monthly) — but only if the product has a long-lifecycle use case. Short-lifecycle B2C (learning, fitness, dating) will be 60-75% no matter what you do.
- Year 3+ (mature): Enterprise SaaS should be <10% annual gross logo churn with 110%+ NRR. Consumer should have moved most acquisition to annual plans, lowering blended annual churn meaningfully.
By segment:
| Segment | Good annual gross churn | Best-in-class |
|---|---|---|
| Enterprise SaaS ($50K+ ACV) | <8% | <5%, with 120%+ NRR |
| Mid-market SaaS ($10-50K ACV) | <15% | <10%, with 110%+ NRR |
| SMB SaaS (<$10K ACV) | <25% | <15%, with 105%+ NRR |
| Consumer subscription (long-lifecycle: streaming, productivity) | <25% | <15% |
| Consumer subscription (short-lifecycle: learning, fitness, dating) | <60% | <40%, achieved mostly via annual plan adoption |
By price point: Inside each segment, higher-ARPU customers churn less. The Recurly data shows under-$25/mo consumer products churn ~6% monthly (~52% annually); over-$1,000/mo SaaS churns ~1.5-2% monthly (~17-22% annually). If you're comparing your churn to a benchmark, make sure the ARPU is in the same range.
The single most useful framing: annual churn matters less than the gap between gross and net annual churn. If you can get your net annual churn to zero or negative (NRR ≥ 100%), the absolute churn number stops mattering as much, because growth compounds on its own.
How to reduce annual churn rate
Annual churn is a downstream metric. The actual levers are upstream — in the cancellation flow, in dunning emails, in onboarding, and in pricing. The shortlist:
1. Fix involuntary churn first. 20-40% of all churn is failed payments, expired cards, and bank-flagged charges. These subscribers want to keep paying. Smart Retries + a 3-4 email dunning sequence + pre-expiration reminders typically recovers 50-70% of failed payments — directly reducing annual churn by 5-15 percentage points with a few hours of setup.
2. Build a real cancellation flow. Intercept cancel intent with pause, downgrade, and (sparingly) discount offers. This typically saves 10-20% of cancel intents, which compounds across a year into 2-5 percentage points off annual churn.
3. Shift more revenue to annual plans. Annual subscribers have one renewal decision per year instead of twelve. Moving 20-30% of subscribers to annual plans alone meaningfully reduces blended annual logo churn. For the formula on setting the annual discount based on your retention data, see annual vs monthly pricing.
4. Run cohort analysis, not aggregate. A single annual churn number hides whether you're getting better or worse. Slice by signup month, by acquisition channel, by plan, and by ARPU band. The cohorts that diverge tell you where to focus.
5. Strengthen onboarding and time-to-value. Long-term annual churn correlates more with first-week activation than anything else. Subscribers who hit a value milestone in their first 7 days churn at a fraction of the rate of those who don't. See customer retention strategies for the playbook.
If you want to run the numbers on your own business, the churn rate calculator handles the monthly-to-annual conversion automatically and shows you how reducing churn by a percentage point or two changes annual revenue retained.
When NOT to obsess over annual churn rate
Annual churn is the headline number, but it's not always the right number to optimize.
When you're a short-lifecycle product by design. Noom, Duolingo, exam prep, weight-loss apps, learn-to-code platforms — these all have natural endpoints. Users achieve the goal (or give up) and leave. Trying to drive annual churn from 65% to 45% in this category fights the product's natural lifecycle. The better lever is pricing annual plans against actual monthly retention (see annual vs monthly pricing) to capture more lifetime value within the natural window.
When you don't have 12+ months of cohort data yet. If your business is 8 months old, you don't have annual churn — you have a compounded estimate. Reporting it as if it's measured creates false precision and bad decisions. Stick with monthly churn and explicit cohort curves until you have a real annual measurement.
When net churn is already negative. If your NRR is 115%+, your existing base grows faster than it shrinks. Gross annual churn is interesting context, but the marginal hour spent reducing it from, say, 12% to 11% returns less than the same hour spent on expansion. Move to playbooks for upselling and seat expansion instead.
When the number is being weaponized in benchmarking arguments. If an investor or board member is pointing at a benchmark and saying "you should be at X" — first check whether their X is on the same cadence (monthly vs annual), the same basis (logo vs revenue), and the same segment (your ARPU and customer profile). Most benchmark arguments dissolve once both sides put numbers on the same footing.
FAQ
Is annual churn the same as monthly churn times 12?
No. Multiplying monthly churn by 12 overstates annual churn because losses compound on a shrinking base, not on the original cohort. The right formula is 1 − (1 − monthly churn)^12. A 5% monthly churn rate equals ~46% annual churn, not 60%. A 3% monthly churn rate equals ~31% annual churn, not 36%.
What's a good annual churn rate for SaaS?
Enterprise SaaS should target under 10% annual gross logo churn, with 110%+ net revenue retention. Mid-market should be under 15%. SMB SaaS realistically runs 15-25% annual churn because customers are smaller, more price-sensitive, and have lower switching costs. Compare against your segment and ARPU band — not the headline benchmarks for the broader industry.
What's a good annual churn rate for consumer subscriptions?
Long-lifecycle consumer products (streaming, productivity, communication) should target under 25% annual gross churn. Best-in-class is Netflix at ~20%. Short-lifecycle consumer products (learning, fitness, dating, weight loss) structurally run 50-70% annual churn because users achieve their goal or give up. In that category the right response is annual plan pricing, not retention heroics.
How do I calculate annual churn from monthly churn?
Use 1 − (1 − monthly churn rate)^12. For example: 4% monthly churn → 1 − (0.96)^12 = 1 − 0.6127 = 38.7% annual churn. 7% monthly churn → 1 − (0.93)^12 = 1 − 0.4186 = 58.1% annual churn. The compounded estimate tends to slightly overstate true annual churn because early-tenure subscribers churn faster than mature ones — so use it as an upper bound until you have real cohort data.
What's the difference between annual logo churn and annual revenue churn?
Annual logo churn counts customers lost over 12 months as a percentage of starting customers. Annual revenue churn counts dollars lost (ARR or MRR equivalent) as a percentage of starting revenue. A business can have 30% annual logo churn but only 10% annual revenue churn if the customers leaving are all on the cheapest plan. Always report both at the annual cadence — they often tell different stories.
What's net annual churn?
Net annual churn is gross annual churn minus expansion revenue (upsells, cross-sells, seat growth, plan upgrades from existing customers) over the same 12-month period. If gross is 20% and expansion adds 25%, net is -5% — meaning your existing base grew in value despite cancellations. The inverse number — net revenue retention or NRR — is what most public SaaS companies report. NRR above 100% means negative net churn.
Why don't most public companies report annual churn directly?
Because there are several defensible ways to calculate it (logo vs revenue, cohort vs averaged, gross vs net) and disclosing one specific number invites comparisons that may not be apples-to-apples. Most disclose NRR, gross dollar retention, or subscriber counts year over year, and let analysts infer churn. Netflix has never disclosed churn in its 10-K. Snowflake reports NRR but not gross logo churn. This is why third-party measurement firms (Antenna, Recurly) exist.
What to Do Next
If you've gotten this far, the playbook is:
- Re-check any annual churn number you've reported in the last quarter. If it was
monthly × 12, restate it with the compound formula before someone else does the math. - Decide on one cadence and one basis for board reporting. Annual revenue churn for board decks; monthly logo churn for ops dashboards. Don't mix them in the same conversation.
- Run cohort analysis on your last 12 months of subscribers. The compound formula is a useful estimate; a real cohort measurement is the truth. Compare the two — the gap tells you whether early-tenure churn is materially different from steady-state.
- Start with the highest-ROI lever to actually move annual churn: fix involuntary churn (see dunning emails), then add a real cancellation flow, then shift more revenue to annual plans.
If you want a complete picture of where your subscription business is leaking revenue — not just churn, but pricing, packaging, conversion, and expansion too — I built a free self-assessment that covers all of it.
Take the Subscription Revenue Leak Audit →
52 checklist items across 8 revenue leak categories. Takes 10 minutes. Shows you exactly where you're leaving money on the table.

Dan Layfield
Dan ran growth at Codecademy, scaling ARR from $10M to $55M before the company was acquired for $525M. He now advises subscription businesses on pricing, retention, and revenue optimization.
Work with Dan →Related Guides
Annual vs Monthly Pricing: How to Set Your Annual Subscription Discount
Most annual subscription pricing is set backwards. Here's how to price annual plans using retention data, with real ratios from Noom, Tinder, and Headspace.
26 min readARR (Annual Recurring Revenue): The Number That Defines Your Subscription Business
ARR is the metric investors, operators, and acquirers care about most. Learn how to calculate it correctly, avoid common mistakes, and grow it.
20 min readSubscription Cancellation Flow: Save 15-25% of Subscribers (With Examples)
Design a subscription cancellation flow that saves 15-25% of subscribers who try to leave. Includes real examples, exit survey templates, and save offer strategies.
Get the playbook every Thursday
Weekly strategies for subscription businesses. Real companies, real numbers, tactics you can steal. From the operator who grew Codecademy from $10M to $50M ARR.