LTV:CAC Ratio: What It Means, How to Calculate It, and What's a Good Ratio
The 3:1 LTV:CAC ratio is folklore. Here's the real benchmark by business stage, channel, and margin profile — with formulas and sourced numbers.
Dan Layfield
Growth at Codecademy, $10M → $50M ARR
In This Guide
- LTV:CAC Ratio at a Glance
- What is the LTV:CAC ratio?
- How to calculate LTV
- How to calculate CAC
- The LTV:CAC ratio formula
- The 3:1 rule and why it's wrong
- LTV:CAC by business stage
- LTV:CAC by business model
- Real-company LTV:CAC ratios
- How to improve your LTV:CAC ratio
- Payback period vs LTV:CAC: which matters more?
- When NOT to optimize for LTV:CAC
- FAQ
- What to Do Next
The 3:1 LTV:CAC ratio is the most-cited and least-useful benchmark in subscription businesses. It originated from a 2013-era investor blog post (David Skok's "SaaS Metrics 2.0" on ForEntrepreneurs.com) and got copied into every pitch deck since. For an early-stage subscription business, 3:1 might mean you're underinvesting. For a mature one, it might mean you're overpaying. The ratio matters — but only when you've corrected for your specific business stage and margin profile.
Most operators underinvest in acquisition because they optimize to a benchmark that doesn't apply to their business. I made this mistake at Codecademy while growing the business from $10M to $50M in ARR (2017-2021). We held our blended LTV:CAC near 3:1 for two quarters, then realized our paid-search and organic channels had radically different ratios — and that "average ratio" was hiding both an under-spent winner and an over-spent loser. The fix wasn't to optimize the blended number; it was to throw out the blended number entirely.
This guide covers the math, the benchmarks, the historical context, and the specific stages and segments where the 3:1 rule actually applies. By the end, you'll have a defensible target ratio for your specific business — not someone else's.
LTV:CAC Ratio at a Glance
| Early stage (0–1M ARR) | Growth stage (1–10M ARR) | Mature (10M+ ARR) | |
|---|---|---|---|
| **Target range** | Above 5:1 (often) | 3:1 to 5:1 | 3:1, with channel-level scrutiny |
| **Why** | Acquisition data is noisy; LTV estimates are optimistic. A high ratio protects against being wrong. | You have enough cohort data to invest aggressively. 3–5x is the efficient frontier. | Channels saturate. The blended ratio hides winners and losers. |
| **Common mistake** | Spending to 3:1 with 6 months of data | Refusing to spend more when ratio is 6:1+ | Optimizing to the blended average instead of by channel |
| **What to do** | Run on payback period (under 12 months) until you have 12-month cohorts | Push acquisition spend until your ratio drops to 3:1 | Cut the worst-performing channel; reinvest in the best |
The short answer: A "good" LTV:CAC ratio depends on your stage, gross margin, and channel mix. Early-stage businesses should target above 5:1 because their LTV estimates are noisy and optimistic. Growth-stage businesses should sit between 3:1 and 5:1 — anything higher means you're underinvesting in acquisition. Mature businesses should ignore the blended ratio and optimize channel-by-channel. The 3:1 number from David Skok's 2013 blog post was correct as a sanity check, but it was never meant as a universal target — and it shouldn't be one for your business either.
What is the LTV:CAC ratio?
The LTV:CAC ratio is a unit economics metric that compares the lifetime value of a customer to the cost of acquiring them. It tells you whether your acquisition spend is sustainable — and at what scale you can keep growing without burning capital.
Before the formula, a few terms need to be precise. Most LTV:CAC arguments are actually fights over which version of LTV or CAC each side is using.
Customer Lifetime Value (LTV). The total revenue (or profit) you expect to earn from one customer over their entire relationship with your business. For a subscription business with $50/month ARPU and 4% monthly churn, the simple LTV is $50 ÷ 0.04 = $1,250. See the customer lifetime value guide for the full set of formulas.
Customer Acquisition Cost (CAC). The fully-loaded cost of acquiring one new customer. Fully-loaded means all sales and marketing spend — paid ads, content production, salaries, tooling, agency fees, attribution gaps — divided by net new customers acquired in the same period.
LTV:CAC ratio. LTV ÷ CAC. A ratio of 3:1 means you earn $3 in lifetime value for every $1 you spend acquiring a customer.
Payback period. How long it takes to recoup your CAC from a customer's monthly gross profit. Payback period is the inverse companion to LTV:CAC — it tells you how long your cash is locked up before a customer becomes profitable.
Gross-margin-adjusted LTV. LTV calculated using gross profit per customer, not revenue. Most "good" benchmarks assume you're using gross-margin-adjusted LTV. If you're using revenue LTV, your ratio is overstated by roughly the inverse of your gross margin (e.g., at 70% gross margin, a "3:1 revenue ratio" is actually 2.1:1 in profit terms).
The first mistake operators make: they compare a revenue LTV against a paid-media-only CAC and report a ratio that looks healthy. Both numbers are wrong, and the errors don't cancel — they compound.
How to calculate LTV
The simplest LTV formula divides average revenue per user (ARPU) by your monthly churn rate. The result is the expected total revenue from one customer before they cancel.
LTV = ARPU × Gross Margin % ÷ Monthly Churn Rate
Worked example for a B2C subscription:
- ARPU: $20/month
- Gross margin: 80% (digital subscription, low cost to serve)
- Monthly churn rate: 5%
- LTV = ($20 × 0.80) ÷ 0.05 = $320
That same business calculated on revenue LTV (ignoring gross margin) would report $400. The $80 gap is the cost to serve — and ignoring it is the most common LTV inflation error.
For businesses with expansion revenue (subscribers spending more over time through upgrades, add-ons, or usage), the denominator becomes "net churn" — gross churn minus monthly expansion rate. A business with 5% gross churn but 2% monthly expansion has 3% net churn, and the LTV jumps from $320 to $533 on the same revenue base. See the customer lifetime value guide for the four formulas (simple, gross-margin-adjusted, with expansion, and cohort-based) and when to use each.
For LTV:CAC specifically, always use the gross-margin-adjusted version. The 3:1 benchmark from David Skok was originally framed in terms of LTV that already accounts for gross margin — using revenue LTV against the same benchmark double-counts your margin.
You can run the LTV calculation interactively in the LTV Calculator.
How to calculate CAC
CAC is conceptually simple — total acquisition spend divided by new customers acquired — but every part of "total acquisition spend" is contested.
CAC = Total Sales & Marketing Spend ÷ Net New Customers Acquired
The three common versions, in order of how much they include:
1. Paid-only CAC. Just paid media spend (Google Ads, Meta, affiliate fees) divided by attributed paid customers. This is the version most paid-search teams report.
- Pros: Easy to calculate, channel-attributable, useful for in-channel optimization.
- Cons: Massively understates true CAC. Ignores the team, the content, the brand, the tooling.
2. Blended CAC. All paid media + content + organic divided by all new customers (paid and organic).
- Pros: Honest portrait of efficiency. The number you'd defend to a board.
- Cons: Penalizes paid channels for organic wins they didn't drive.
3. Fully-loaded CAC. Blended CAC plus salaries, tools, agency fees, free-tier server costs, conference sponsorships — everything that exists because you're trying to acquire customers.
- Pros: The truest number. Use this for unit economics decisions.
- Cons: Most companies don't track to this level. Painful first time you build it.
Worked example for a Series A SaaS business:
- Monthly paid ad spend: $50,000
- Content + SEO team (loaded): $25,000/month
- Sales team (loaded): $40,000/month
- Tools & overhead: $5,000/month
- Total monthly S&M: $120,000
- New customers acquired this month: 80
- Fully-loaded CAC = $120,000 ÷ 80 = $1,500
The paid-only CAC for the same business would be ~$700 (assuming 70% of customers are paid-attributed). The 2.1x gap is the difference between an LTV:CAC ratio that looks great in a deck and one that survives a CFO's audit.
A note on attribution. New customers acquired should be net of cancellations within a short evaluation window (typically 30-60 days). A customer who cancels in their first month wasn't acquired — they were a refund. See the CAC payback calculator for the related question of how fast you recover this spend.
The LTV:CAC ratio formula
Once you have both inputs defined consistently, the formula is straightforward:
LTV:CAC Ratio = Customer Lifetime Value ÷ Customer Acquisition Cost
Worked example, combining the LTV and CAC above:
- LTV (gross-margin-adjusted): $1,000 (assuming a $50 ARPU, 80% margin, 4% churn B2B SaaS)
- CAC (fully-loaded): $300
- LTV:CAC = $1,000 ÷ $300 = 3.3:1
The ratio tells you whether you can sustain your current acquisition spend. A ratio of 3.3:1 means every dollar you spend on acquisition returns $3.30 in gross profit over the customer's lifetime. The 2.3x markup covers your operating costs, R&D, G&A, and (eventually) profit.
This is also where the LTV:CAC Ratio Calculator becomes useful — once you have both inputs, you can stress-test the ratio against different churn assumptions, different CAC definitions, and different payback periods in seconds.
The 3:1 rule and why it's wrong
The 3:1 LTV:CAC benchmark comes from a single source: David Skok's "SaaS Metrics 2.0" article on ForEntrepreneurs.com, published in the early 2010s. Skok validated the heuristic across his Matrix Partners portfolio and wrote: "The best SaaS businesses have a LTV to CAC ratio that is higher than 3, sometimes as high as 7 or 8." He also recommended CAC payback in 5–7 months and explicitly warned that "there are always situations where it makes sense to break them" (source: SaaS Metrics 2.0 on ForEntrepreneurs.com).
The framework was correct for what it was: a sanity check for the venture-backed B2B SaaS companies in Skok's portfolio in 2011. It was never meant as a universal target.
Three reasons the 3:1 rule misfires when applied broadly:
The insider subscription playbook
One tactic that moves the needle — every Thursday
Real companies, real numbers, strategies you can steal. From the operator who grew Codecademy from $10M to $50M ARR.
1. It assumes you're already at scale. A pre-product-market-fit company with 6 months of data has no meaningful LTV — the cohort is too young, churn is too noisy, and expansion is non-existent. Optimizing to a 3:1 ratio off a guessed LTV is calibrating a thermostat with a broken thermometer.
2. It ignores gross margin. A 3:1 ratio at 90% gross margin (digital subscription) and a 3:1 ratio at 40% gross margin (hardware + service bundle) are radically different businesses. The first one is healthy; the second is losing money the moment you account for cost to serve.
3. It ignores capital structure. A venture-backed business that's burning to grow can rationally run at 2:1 or worse for years — because the LTV is real but the cash flow is delayed. A bootstrapped business with no runway needs 5:1+ to fund growth from operations. The "right" ratio depends on who's funding the gap.
The Bessemer Venture Partners "fundability benchmarks" — published in the State of the Cloud 2023 — frame this more usefully. Instead of a single LTV:CAC target, they report CAC payback period tiers: "Good" = 12–18 months, "Better" = 6–12 months, "Best" = 0–6 months. The same report puts Net Revenue Retention tiers at "Good" 100%, "Better" 110%, "Best" 120%+. These tiered benchmarks accept that the right number depends on what stage of company you're trying to build.
The 3:1 ratio is fine as a starting reference. Treat it as the speedometer in your car — useful for noticing when you're way off, useless for fine-tuning at speed.
LTV:CAC by business stage
The most important correction to the 3:1 rule is for company stage. Your LTV estimates get sharper as you accumulate cohort data, and your acquisition strategy changes as channels scale.
Early stage (0–1M ARR)
Target: above 5:1, or just track payback period
Your LTV is almost certainly wrong. You don't have 12-month cohorts; you're extrapolating from 3–6 months of retention data, which underweights early churn and overweights the survivors. A "3:1 ratio" on bad LTV is meaningless.
What to do instead: track CAC payback in months. If you recover your CAC within 12 months of acquisition, you have a viable unit economics story regardless of what your projected LTV says. The CAC payback calculator is the tool to use here.
A high target ratio (5:1+) gives you margin for error in your LTV estimate. If your real LTV turns out to be 40% lower than projected, a 5:1 ratio drops to 3:1 — still survivable. A 3:1 ratio drops to 1.8:1 — game over.
Growth stage (1–10M ARR)
Target: 3:1 to 5:1, with channel-level visibility
You have enough cohort data to trust your LTV calculations within reason. You're scaling acquisition aggressively across multiple channels. This is the stage where 3:1 actually applies as a target — but with an important corollary: above 5:1 likely means you're underinvesting.
This is the most common mistake at this stage. A company hitting a 6:1 ratio thinks they're doing great. They're actually leaving growth on the table. If your ratio is 6:1, you could be spending 60-70% more on acquisition and still hit a healthy 3:1 — which would mean 60-70% more customers, more revenue, and a defensible market position before competitors catch up.
The instinct is to bank the efficiency. The math says spend it.
Mature (10M+ ARR)
Target: 3:1 blended, but optimize by channel
At maturity, the blended ratio becomes misleading because your channels have diverged. Your organic-search ratio might be 8:1 while your paid-Meta ratio is 1.5:1, and the blended number tells you nothing about how to act.
What to do: calculate LTV:CAC by acquisition channel (and ideally by customer segment within channel). Cut spend on channels below 2:1. Aggressively reinvest in channels above 4:1 until they regress to 3:1. The goal is not to maximize the blended ratio — it's to maximize total gross profit subject to a 3:1 floor on incremental spend.
This is exactly the lesson we learned at Codecademy. We held our blended ratio near 3:1 for two quarters before we realized the organic channel was at 6:1 (severely under-funded) and our paid YouTube channel was at 1.4:1 (burning money). Splitting the analysis by channel changed our spending pattern within a month.
LTV:CAC by business model
Stage matters most. But business model is the second-biggest correction — different models have structurally different ratios, and benchmarking yourself against the wrong model gives you the wrong target.
| Business model | Typical LTV:CAC target | Why |
|---|---|---|
| **Consumer subscription (B2C)** | 2:1 to 3:1 | Lower ARPU, higher churn, shorter lifetimes. Ratios above 4:1 are rare and usually indicate underinvestment. |
| **B2B SaaS (SMB)** | 3:1 to 5:1 | Moderate ARPU, contracts with annual commitments, expansion revenue available. The textbook segment for the 3:1 rule. |
| **B2B SaaS (mid-market)** | 4:1 to 6:1 | Higher ACV, longer sales cycles, sticky integrations. Justifies higher acquisition spend. |
| **Enterprise SaaS** | 5:1 to 10:1+ | Six- and seven-figure contracts, 90%+ logo retention, multi-year deals. Often constrained by sales capacity, not unit economics. |
| **Hybrid (PLG + sales-assist)** | 3:1 to 5:1 | Behaves like SMB on the self-serve tier and like mid-market on the sales-assist tier. Worth splitting the ratio by motion. |
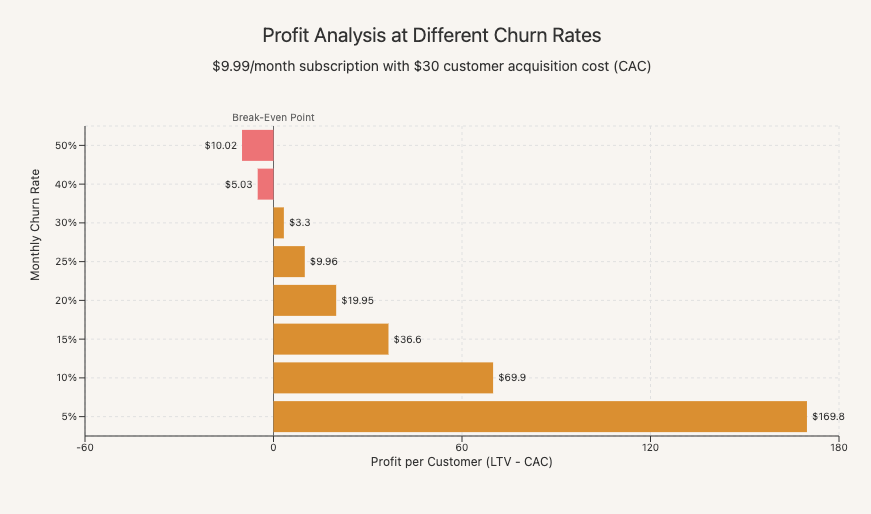
Why consumer subscriptions sit lower: consumer businesses live and die by churn rate, and the math compounds against you. A B2C subscription at $10/month with 6% monthly churn has an LTV of ~$140 (revenue) or ~$112 (at 80% margin). With a CAC of $40, that's a 2.8:1 ratio. The business is healthy — but a 3:1 hardcoded target would have you cut acquisition spend below profitable levels.
Why enterprise sits higher: enterprise CAC is dominated by sales salaries and is often capped by sales-team capacity rather than spend. The "right" ratio is whatever your sales motion produces; the lever is hiring sales reps faster, not cutting spend per rep.
Real-company LTV:CAC ratios
Public companies rarely disclose LTV:CAC directly. What they do disclose: revenue, customer counts, sales-and-marketing spend, net dollar retention, and (sometimes) ARPU. The ratios below are derived from those disclosures unless noted as disclosed.
| Company | Approximate LTV:CAC | Source / how derived | Notes |
|---|---|---|---|
| HubSpot | 4:1 to 5:1 (derived) | HubSpot 10-K filings; revenue $2.63B in 2024, 8,246 employees ([Wikipedia: HubSpot](https://en.wikipedia.org/wiki/HubSpot)). Net revenue retention historically ~104-110%. | Mid-market SMB SaaS. Ratio derived from disclosed ARPU (~$11K), historical 8-10% gross logo churn, and S&M as ~50% of revenue. |
| Snowflake | 6:1+ (derived) | Snowflake 10-K filings; product revenue $4.72B FY26, RPO $9.77B, NRR historically 120-130%+ ([Wikipedia: Snowflake](https://en.wikipedia.org/wiki/Snowflake_Inc.)). | Enterprise data infrastructure with usage-based pricing. Strong expansion revenue (NRR >120%) inflates LTV materially. |
| Datadog | 5:1+ (derived) | Datadog earnings reports; NRR historically 130%+ (peak), customer count ~30K+ with $100K+ ARR customers >3K. | Best-in-class NRR makes effective LTV very high. Ratio derived rather than disclosed. |
| Asana | ~2:1 to 3:1 (derived) | Asana 10-K filings; revenue $724M FY25, 131,000+ customers as of 2022 ([Wikipedia: Asana](https://en.wikipedia.org/wiki/Asana,_Inc.)). | SMB-heavy PLG. Smaller average customer + heavier S&M intensity historically yielded a tighter ratio. |
| Zoom | 3:1 to 4:1 (derived) | Zoom 10-K filings; net dollar expansion peaked above 130% during 2020-2021 pandemic surge, normalized since. | The 2020-2021 ratio was extraordinary (huge expansion + low CAC from organic demand). Post-pandemic normalization brought it closer to category norms. |
| Duolingo | 5:1+ (derived) | Duolingo investor materials; revenue $748M (2024) up from $531M (2023); 10.9M paid subscribers (June 2025) on ~130M MAU; ~6.8% conversion from free ([Wikipedia: Duolingo](https://en.wikipedia.org/wiki/Duolingo)). | Consumer subscription with very low blended CAC due to organic/viral acquisition. Free → paid funnel does most of the acquisition work. |
A note on derivation: deriving LTV:CAC from public disclosures requires assumptions about gross margin, churn, and customer mix that the company doesn't publish. The numbers above are directional, not precise. They're useful for noticing that the spread between Duolingo (organic-driven consumer) and Asana (paid-heavy PLG) is wider than the 3:1 rule would suggest.
For benchmarking more recent data points yourself, the most accessible public sources are:
- Bessemer State of the Cloud — annual benchmarks on CAC payback, NRR, growth tiers
- Meritech Capital benchmarking — public-company SaaS comparables (note: comps table now behind a login)
- OpenView SaaS Benchmarks — annual operator survey (now Paddle-published)
- KeyBanc Private SaaS Survey — private-company unit economics
- Individual company 10-Ks and S-1s — the only source for first-party numbers
How to improve your LTV:CAC ratio
If your ratio is below your target, you have exactly two levers: raise LTV or lower CAC. In practice, raising LTV usually compounds more.
Reduce churn. The single highest-leverage move. Reducing monthly churn from 5% to 3% increases average customer lifetime from 20 months to 33 months — a 65% LTV boost with no change to pricing or expansion. Start with involuntary churn (failed payments) — it's the cheapest fix. See the churn rate guide and customer retention strategies for the playbook.
Raise prices on new customers. A 10% price increase on new sign-ups, assuming no churn or conversion impact, raises LTV by 10% and improves the ratio proportionally. Grandfather existing customers to avoid backlash. Most subscription businesses haven't revisited pricing in 12+ months and are undercharging.
Build expansion revenue. A 2% monthly expansion rate on a business with 4% churn cuts net churn in half — doubling LTV. Tiered plans, usage-based pricing, and add-ons are the structural tools. See upselling for specific mechanics.
Shift to annual plans. Annual subscribers churn at meaningfully lower rates than monthly subscribers because there are 11 fewer decision points per year. Even moderate annual adoption (30% → 50%) shifts the blended retention curve. See annual vs monthly pricing for the discount-setting formula.
Optimize onboarding for early retention. Most churn happens in months 1-3. If you can get users to their first value moment faster, you reduce early churn and extend the lifetime of your most vulnerable cohort. The compounding effect on LTV is larger than any acquisition optimization.
Cut your worst-performing acquisition channel. Most companies have at least one paid channel running at 1:1 or worse. Killing it doesn't reduce growth proportionally because the customers it acquired were marginal — and the savings reinvested in your top channel usually produce more total customers.
Stop reporting blended CAC. Once you split by channel, you'll find a 3:1 channel and a 6:1 channel. The 6:1 channel is underspent. Reinvest there before optimizing the rest.
The first four levers raise LTV. The last three lower CAC. Pick the lever with the highest expected impact in your specific business — for most subscription businesses, churn reduction comes first.
Payback period vs LTV:CAC: which matters more?
For early- and growth-stage subscription businesses, CAC payback period matters more than LTV:CAC. Payback period tells you how long your acquisition spend is locked up before it returns cash. LTV:CAC tells you the total return you'll eventually earn — but "eventually" is months or years away.
CAC Payback = CAC ÷ (ARPU × Gross Margin %)
A business with a 6-month payback can reinvest profits from each cohort into the next cohort within the same year. A business with a 24-month payback is essentially financing two years of growth before seeing any cash back. Same LTV:CAC; radically different cash dynamics.
Bessemer's published payback benchmarks (from State of the Cloud 2023):
- Best: 0–6 months
- Better: 6–12 months
- Good: 12–18 months
- Anything beyond 18 months requires very strong retention to justify
Use LTV:CAC to assess whether you should keep spending. Use payback period to assess whether you can afford to keep spending right now. The two metrics answer different questions, and the right business optimizes both.
When NOT to optimize for LTV:CAC
LTV:CAC is the wrong primary metric in several situations. Optimizing to it anyway leads to bad decisions.
You're pre-product-market-fit. With less than 6 months of cohort data, your LTV is a guess. Optimizing acquisition spend against a guessed LTV produces decisions that look rigorous but are arbitrary. Track payback period and 30/60/90-day retention curves instead, and revisit LTV:CAC once your churn stabilizes.
You're venture-funded and pursuing winner-take-most market dynamics. If you're racing to lock up a market before competitors, a 1.5:1 ratio for 18 months may be the correct decision — you're paying for market position, not unit economics. The decision frame is "what's the cost of losing this market" not "what's our ratio this quarter." Bessemer's own "Best" growth tier (125%+ revenue growth) cannot coexist with a 5:1 ratio; you have to choose.
You're entering a new market or launching a new product line. Early acquisition data in a new segment is noisy. Holding new-market spend to the same ratio target as your established business will starve the new market of the investment it needs to find product-market fit. Run new markets on a separate budget and separate metrics for the first 6–12 months.
Your business has a hard endpoint. Wedding planning. Exam prep. Pregnancy apps. These products have a structurally capped LTV because the customer relationship ends when the use case ends. The right metric is contribution margin per acquired customer, not LTV:CAC — because the "lifetime" frame doesn't apply.
You're optimizing past your cash horizon. A 36-month LTV looks great in a deck, but if your runway is 12 months, decisions should be driven by 12-month contribution margin. Optimizing to a theoretical LTV you'll never collect is how venture-funded companies run out of money while showing healthy unit economics.
FAQ
Is 3:1 still the right benchmark for LTV:CAC?
3:1 is a starting reference, not a target. For early-stage businesses, the right target is usually higher (5:1+) because your LTV estimates are noisy. For growth-stage businesses, 3:1 to 5:1 is the efficient frontier — anything above 5:1 likely means you're underinvesting in acquisition. For mature businesses, the blended ratio matters less than the channel-by-channel breakdown. David Skok's original 2010s-era framing was correct as a sanity check; using it as a universal target is what's wrong.
Should I include gross margin in my LTV calculation?
Yes, almost always. The standard LTV:CAC benchmarks (including the 3:1 rule) implicitly assume gross-margin-adjusted LTV. If you use revenue LTV against a 3:1 target, you're overstating your ratio by roughly the inverse of your gross margin. For a digital subscription at 85% gross margin, the distortion is modest. For a hardware-plus-software business at 40% gross margin, the gap can flip a "healthy" business into one that's losing money.
What about blended CAC vs. paid CAC?
Use blended (or fully-loaded) CAC for unit economics decisions. Paid-only CAC is useful for in-channel optimization — it tells you whether a specific Meta or Google campaign is working — but reporting it as your business's "CAC" is misleading. Blended CAC is the honest portrait. Fully-loaded CAC (which adds salaries, tools, and overhead) is the truest, but most companies don't track to that level until late growth stage.
Is LTV:CAC the same as LTV/CAC?
Yes. LTV:CAC, LTV/CAC, LTV-to-CAC, and "the ratio" all refer to the same metric: lifetime value divided by acquisition cost. The colon notation (e.g., 3:1) is more common in pitch decks; the slash notation (3.0) is more common in spreadsheets and dashboards. Both mean the same thing.
What's a good CAC payback period?
Under 12 months for most subscription businesses; under 6 months is best-in-class. Bessemer's State of the Cloud 2023 frames the tiers as Good (12–18 months), Better (6–12 months), Best (0–6 months). For consumer subscriptions with lower ARPU, you want payback under 6 months because cohorts churn faster. For enterprise SaaS with multi-year contracts, payback up to 18 months can be justified. See the CAC payback calculator to model your own.
How does net revenue retention change LTV:CAC?
It changes it dramatically. If your subscribers spend more over time, your effective churn rate drops below your gross cancellation rate — which inflates LTV. A business with 5% gross monthly churn and 2% monthly expansion has 3% net churn, and LTV is ~67% higher than gross-churn-only math would suggest. This is why companies with strong NRR (Snowflake, Datadog, HubSpot) report LTV:CAC ratios that look extraordinary compared to consumer subscriptions with similar gross retention.
Can my LTV:CAC ratio be too high?
Yes. A ratio above 5:1 in a growth-stage business almost always means you're underinvesting in acquisition. The math: if you could spend 50% more on acquisition and still hit a 3:1 ratio, you'd capture 50% more customers — more revenue, more market share, more defensibility before competitors catch up. Banking the efficiency feels prudent. It's usually leaving growth on the table.
What to Do Next
If you've gotten this far, you have enough framework to set a defensible LTV:CAC target for your specific business. The fastest way to apply it: plug your actual LTV and CAC into the calculator, stress-test the ratio against different churn and margin assumptions, and identify your highest-leverage improvement.
Calculate your fully-loaded CAC. Don't use paid-only CAC for this. Add up all sales and marketing spend (including loaded salaries) and divide by net new customers acquired in the same period.
Calculate your gross-margin-adjusted LTV. Use the LTV Calculator — ARPU × gross margin ÷ monthly churn. If you have expansion revenue, use net churn (gross churn minus expansion rate) for the denominator.
Compute your ratio. Use the LTV:CAC Ratio Calculator to get the number and see where it sits on the spectrum.
Compare against the right benchmark. Not 3:1. The right benchmark for your stage (early / growth / mature) and business model (consumer / SMB / mid-market / enterprise) from the tables in this guide.
Identify your highest-leverage improvement. Below target → focus on churn (highest leverage) or pricing. Above 5:1 in a growth-stage business → spend more on your top-performing channel until the ratio compresses to 3:1.
Split the analysis by channel. Once your blended ratio looks healthy, calculate it by acquisition channel. There's almost always a channel above 5:1 (underspent) and a channel below 2:1 (overspent). Reallocating spend usually improves the blended ratio without changing total budget.
The LTV:CAC ratio isn't a number to hit and forget. It's a feedback loop. Pricing changes, retention improvements, and channel mix shifts all show up here — and recalculating quarterly tells you whether your monetization is improving or sliding.
Calculate your LTV:CAC Ratio → — free, no email required, runs the math against your inputs in seconds.
If you want to go further and find every place your subscription business is leaking revenue — pricing, packaging, conversion, churn, expansion, and more — the Revenue Leak Audit walks you through 52 checklist items in 10 minutes and shows you where to focus.

Dan Layfield
Dan ran growth at Codecademy, scaling ARR from $10M to $55M before the company was acquired for $525M. He now advises subscription businesses on pricing, retention, and revenue optimization.
Work with Dan →Related Guides
Net Revenue Retention: The Metric That Proves You Can Grow Without More Traffic
Net revenue retention (NRR) shows if your existing subscribers are becoming more valuable. Learn how to calculate, benchmark, and improve it.
31 min readPrice Localization: How Subscription Businesses Unlock International Revenue
Learn how to implement price localization for your subscription business — from currency display to full purchasing power parity (PPP) adjustments. Stop losing international customers.
15 min readRecurring Revenue: How to Grow It Without Growing Your Traffic
Stop trying to grow recurring revenue by acquiring more customers. A subscription growth framework: six levers to make more from the subscribers you already have.
Get the playbook every Thursday
Weekly strategies for subscription businesses. Real companies, real numbers, tactics you can steal. From the operator who grew Codecademy from $10M to $50M ARR.